Chroma

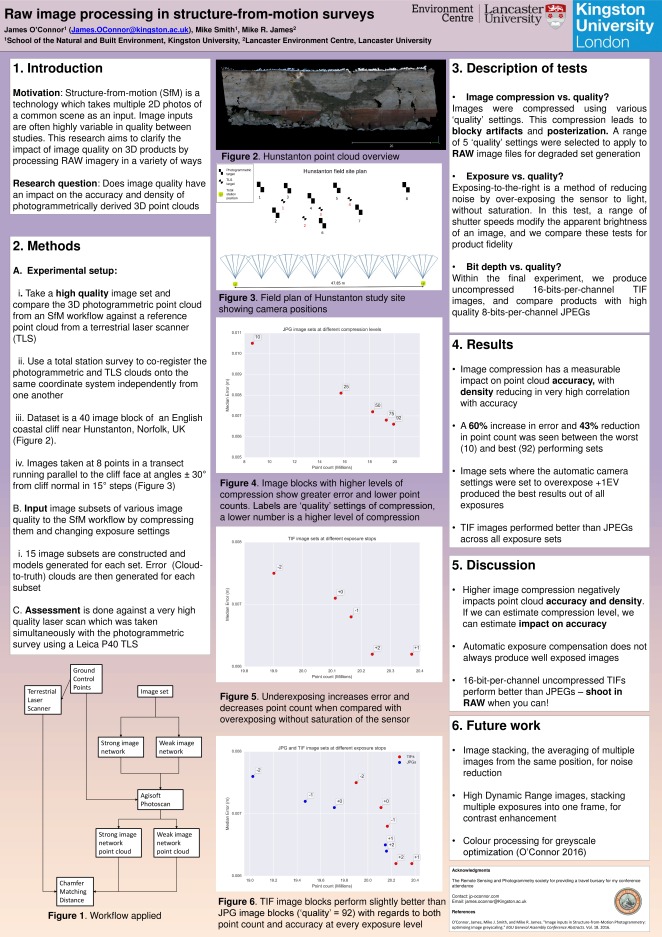
I’ve been neglecting this blog of late, partly because I’ve been ill and partly because I’ve been focusing my writing efforts elsewhere, but thought it was due time I put something up. Followers might remember that last year at EGU I presented a poster detailing results of investigating the variation of the greyscale input channel into Structure-from-Motion (SfM) photogrammetric blocks. Whilst the results showed very slight differences, I didn’t present one interesting, subtle effect, which shows how robust the process is to differences within images.

Within the SfM process, camera parameters which correct for distortions in the lens are fitted, which can subsequently be extracted for separate analysis. Returning to the greyscaling theme for inclusion in my final thesis, I’m pulling out the lens models for each block, and noticed the focal length being fitted to each block subtly changing, but in a manner we might expect.

Chromatic aberration

Chromatic aberration is caused by differences in the refractive indices of the glass in the lens between light of different wavelengths, which causes the focal point of the image formed for each wavelength to be slightly different. Thus, in colour images and for other optical equipment (I remember seeing it in many different sets of binoculars), we can see colour banding around the edges of high contrast features.

DSC00128_crop

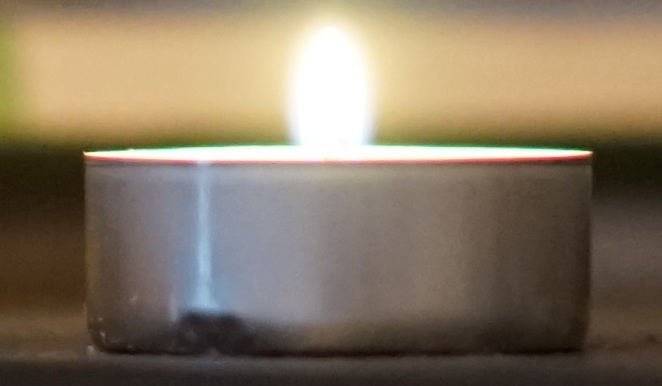
Chromatic aberration seen at the front (red fringe) and back (green fringe) of the candle

Within photogrammetric blocks using single channel, we might expect the focal length to be optimised for specifically that colour’s focal length as it interacts with the specific lens being used. Indeed, this is demonstrable in the tests I have run – we see a slight lengthening of the focal length as more of the red channel is introduced to the image block accounting for the interaction with the lens, testing on an RGB image set collected of a cliff near Hunstanton, UK.

focal_lengths.png

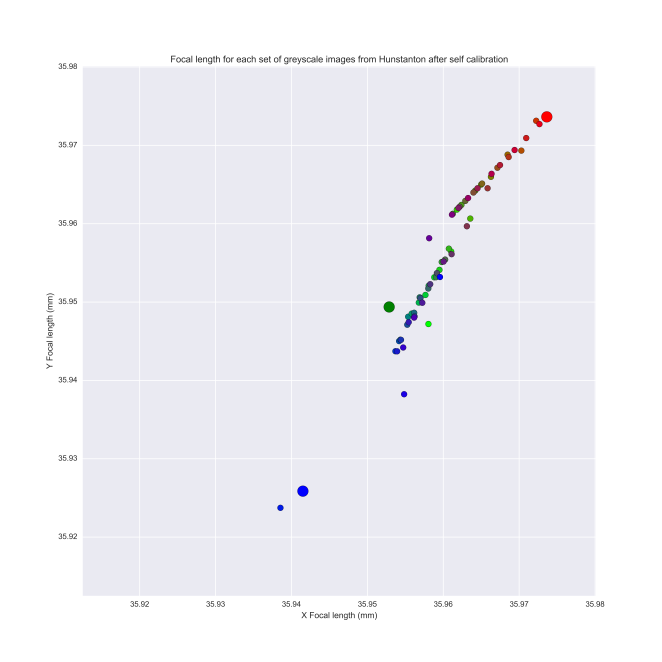
Self-calibrating bundle adjustment fits longer focal lengths to greyscale bands containing a greater proportion of the red channel from an RGB image. Colours of the plotted points represent the RGB colour combination the greyscale photogrammetric block was derived from. The larger circles represent pure red, green and blue channels.

Whilst this might be expected, I was surprised by how obvious a trend was being shown, and it’s testament to how sensitive SfM is at picking up even small changes in image blocks. Watch this space for more insight into what this means for assessing quality of images going into SfM procedures, and how we might gain intuition into image quality as a result of this trend!

EGU 2017

As a result of a travel grant awarded to me by the Remote Sensing and Photogrammetry Society, I was lucky enough to be able to return to EGU this year, albeit only for the Wednesday. I was there to present my research, in a poster format, based on raw image processing in structure-from-motion workflows. After arriving in Vienna on Tuesday afternoon I went straight the hostel I was staying at to review my poster and to finalize the sessions I would go to.

I got to the conference early in the morning, and set up my poster which was to be presented during the high resolution topography in the geosciences session. After taking a short break to grab a coffee, I headed over to the first session of the day – Imaging, measurements and modelling of physical and biological processes in soils. After last year’s fascinating run of discussions about soil and soil erosion, I decided my one day at EGU would be largely dedicated to that theme!

One particular talk which caught my eye used data fusion of laser scanning and NIR spectrometry with the goal to couple the two datasets for use in examining feedbacks in soil processes. Some very cool kit, and very blue-sky research, a good way to start the day!

After lunch, I almost exclusively attended a land degradation session, which featured some very interesting speakers. Many focused on integrating modern techniques for prevention of soil erosion and gully formation into farming practices in Africa. Interestingly, while the talks almost all focused on case studies and success in showing the physical effects of taking these actions, the Q & As were very much about social aspects, and how to bring about the cultural change within farming communities.

Another notable talk was given by a group who were aiming to promote the use of a targeted carbon economy which sees citizens from carbon consuming countries pay for the upkeep and management of forestry in developing communities. The presentation was very clear and set solid numbers onto each factor introduced, which meant it was much easier to share the vision portrayed, definitely something I’ll be following in the future!

This lead to the poster session in which I was participating, which was well attended and seemed to generate lots of interest. By the time I arrived to present at the evening session, the 15 A4 posters I had printed had been hoovered up, which is always a good sign! Over the course of the hour and a half I was visited by many people who I had met before at various conferences – it’s always nice to have people you know come to say hello, especially as affable a bunch as geomorphologists!

out_poster.jpg

The poster I presented

One group of particular interest were from Trinity College Dublin, where I had done my undergraduate degree many moons ago. Niamh Cullen is doing research into coastal processes in the West of Ireland and is using photogrammetry to make some measurements, and so we had a very good discussion on project requirements/best strategy. She’s also involved in the Irish Geomorphology group, who’s remit seeks to establish a community of geomorphologists in Ireland.

In the evening I attended the ECR geomorphologist dinner, which was great fun, a good way to wrap up proceedings! I look forward to participating in EGU in the future in whatever capacity I can.

Isoluminance in stereo

Luminance (somewhat analogous to Radiance which I’ve discussed before) is a funny thing, it and its effects on human color perception have been discussed at length in academic circles. It is thankfully an SI unit, and can ground us in beginning discussions on how to interpret image data. The benefits of using SI units, as discussed before on this blog, include being able to conduct lab tests within which we have an absolute unit on which to control experiments.

Luminance has its issues however, as it is altogether separate from any chromatic information contained in a pixel due to the fact that it’s a measure of power. This is summed up neatly within the Helmholtz-Kohlraush effect, where for certain RGB-Gray conversions, different colours which are very apparent to the human observer will be converted to the same histogram in grayscale due to having the same luminance (Figure 1, colour image above the line – converted to grayscale below it).

Figure 1. By Tyathalae – Own work. Licensed under CC BY-SA 4.0 via Wikimedia Commons

Recently, we’ve been seeing more discussions on these issues as multi-view stereo becomes more popular due to the ease of accessibility. Within certain software packages (Such as VisualSfM, MicMac) we see the standard NTSC mapping being used, typified by a linear conversion:

R*0.299 + G*0.587 + B*0.114

There are many sensible reasons why this is used, but are mainly grounded on tri-stimulus color theory with regards to human vision. The fact that this has the potential to map different colours to the same luminance points towards an area which potentially hasn’t been optimized in stereo setups, though frequently discussed (Benedetti et al. give a good summary). If we encounter isoluminant surfaces and are engaging in any sort of sparse/dense stereo matching we may get into trouble.

To remedy this, many scientists have embarked to try to optimize the use of chrominance information in these conversions (See Grundland, 2005 for one example or this page for a summary of various work). This is easier said than done, as in the challenging conditions where this will particularly needed such as a bright scene with multiple isoluminant colours, having a limited number of histogram bins in which to place the data can be tricky.

For multi-view stereo, there is another consideration which hasn’t been as widely discussed. While performing non-linear conversions can be very useful, once these are applied across an image block the conversions may yield inconsistent results depending on the image content. I can imagine image blocks where this may be particularly apparent, for example when there is a dramatic color change over several images which doesn’t exist in other parts of the block. Thus, when considering multi-view stereo when using conversions where color-balance will be lost my gut says that there’s a chance we’re over-processing.

I’ve been considering this for several months now, and as we begin to see claims of improvements in the process, I’ll be sure to keep on reading and give my 2 cents on which methods I think would be best, stay tuned for more!