SentinelBot upgraded

I’ve been on a webdev kick since starting a new job, and have recently upgraded SentinelBot as a result. It now filters snow scenes less often and can handle atmospherically corrected products – I’ll be updating the github repository, and will be writing a post about my current job soon, but for now feast your eyes on some Sentinel goodness 🙂


Predictions, predictions, predictions

I’ve just listened to the latest episode of Alastair and Andrew‘s podcast, scene from above, and the discussion section based around near-future predictions for the Earth Observation (EO) industry, as well as some of the discussion in the news section, was extremely interesting. I’m fully onboard the hype train for machine learning booming in EO, with Andrew seemingly somewhat skeptical.

Before I go into why I think that’s the case, I’ll mention Alastair speaks about a Voyager documentary, the Farthest (I’ve actually just noticed a big Irish producer, crossing the line was involved in production, wahay!). It sounds absolutely incredible, and will go on my watch list, but Alastair’s comments reminded me of an xkcd comic alluding to the fact that the edge of the solar system is difficult to define! I actually really enjoyed listening to their thoughts on Voyager in general, and would love to hear more discussion around the history of EO as well as wider planetary missions – every time I read and think about Corona, for example, I can’t help but be amazed.

far

Voyager spacecraft (NASA)


One of the main predictions made within the main section of the podcast is that analysis ready data (ARD) will see wider use and release by data providers. We have seen a move towards sentinel 2 ARD and planet have recently released their atmospherically corrected surface reflectance product, I would hope this is an indication that this is quite well developed already!

planet.png

A figure from Planet’s surface reflectance white paper (source)

On the machine learning (ML) front, I attended a google earth engine workshop at the beginning of this year, and having had fruitful discussions with the host on the project’s directions, I think the iron is hot for ML and the hype justified. In particular, the host spoke about the team preparing tensor flow integration into the platform in time for AGU next year. Having been lucky enough to participate in (albeit not at a competitive level) the planet kaggle competition for classifying image excerpts into one or more classes last year, I have a decent idea of just why there has been a frenzy of research surrounding convolutional neural networks (CNNs) in the computer vision community, and I’m surprised that they haven’t appeared more in EO research.

While Andrew notes that supervised and unsupervised classification has been around and used for decades, the difference between those and deep-learned information is like night and day in my opinion. The competition, past the task presented, gave me a look into how neural networks are transforming image analysis, and how recurrent CNNs on massive scales could be leveraged in an environmental context for things like linking phenological mapping to data which might provide reasons as to why a change is happening with spatial context. Object-based analysis is unparalleled for applications like this, and CNNs are now so easy to use and much better at handling massive data sets than previous methods. Computer scientists are poised to integrate more and more with the EO community as higher resolution data becomes available, and so I feel like when high temporal and spatial resolution open data becomes available multi-disciplinary research will really kick off. Infact, I put together a starter ipython notebook for bird identification, showing just how easy it is using a pre-trained CNN for this application, albeit not with EO data.

birds.png

Example plot from ipython notebook

This leads to a prediction of my own – as more imaging scientists move into EO, Unmanned aerial vehicle (UAV) and satellite data will need to be better integrated. Currently, there are a raft of problems linking data collected from consumer level cameras onboard UAVs to satellite data, not least of which is radiometric normalization. The demand for higher resolution data from the deep learning end of the community will lead to new standards being introduced for how UAV data is collected and metadata stored (shameless plug). EO platforms will begin to integrate publicly collected UAV data and satellite researchers will begin to collaborate with computer scientists using nearer earth images. We will then see satellites being used as an early warning systems and UAV missions automatically launched off the back of satellite derived information in a range of new applications.

This isn’t a particularly insightful prediction, but one which continuously hasn’t really been addressed. I’m always surprised as to how infrequently satellite and UAV data are used in tandem, but I’m hoping this will change!

That’s all for now, look for my Google Earth Engine blog coming next week, I was blown away by the product and definitely need to do a separate post on it 🙂

RSPSoc Annual Conference

I had a great time at the RSPSoc conference yesterday, and very much enjoyed catching up with the some of the people I made friends with at Wavelength this year – this is a short entry to just make available the slides of both Mike (supervisor) and myself, who’s primary focus was on image quality in photogrammetric work. Unfortunately I think I filled my slides a little too much and probably could have put in about half the content, but somehow couldn’t stop adding plots from the beautiful seaborn library, lesson learned!

Link to Mike slides

Link to my slides

Looking forward to writing a blog on RAW – JPEG conversions very soon, check the undemosaiced sneak preview below 😉

imtest.png


Sentinel_bot – now with NIR vision

A quick blog post as I’m very much in the throes of writing! I took a few minutes today to introduce false colour (Near Infrared – Red – Green) images into @sentinel_bot’s programming, so now there’s a 20% chance that an image it produces will be false colour. In the near future I think I’ll introduce other band combinations (such as PCA band combos for mineral contrast enhancement), but for now I’m going to let it sit and appreciate some of what it comes up with, such as the image below.

Source : https://github.com/JamesOConnor/Sentinel_bot

Twitter : www.twitter.com/sentinel_bot

dgs6xtyxyaadcvj

NIR – R – G image over Argentina

Neural nets in Remote Sensing

Neural nets, a summary: (The chain rule * your GPU RAM)

Around 2 years ago I remember having a discussion with Jan Boehm about photogrammetry after my first meeting as the shadow wavelength rep on the Remote Sensing and Photogrammetry committee. He mentioned Agisoft, which I was already using and familiar with at the time, but then mentioned the movement in dense matching algorithms towards use of neural nets, mentioning one which had been submitted to the KITTI stereo benchmark.

right_cnn

Disparity map using Žbontar’s methods

This piqued my curiosity, and I remember reading and being quite excited by Jure’s paper. While some concepts were new to me, the use of Convolutional neural networks (ConvNets) and the two types of architecture used to initialize the initial results, before moving towards post-processing using semi-global matching. I remember sinking a great deal of time into reading about the methods, exploring the github and methods used within the core of the paper, and subsequently hounding a colleague who was using a Titan-X for some deep learning work for some time with it.

I remember I took the ideas with me to EGU 2016, and even went to the point of acquiring a data set I thought would be worthy of testing it with from a German photogrammetrist, Andreas Kaiser. Alas, it wasn’t to be due to the hardware limitations and the fact that I wasn’t very familiar with the lua programming language. However I had learned a lot about the nature of deep learning, which I felt was a decent investment of my time.

The reason for this blog entry, however, isn’t to enlighten the reader of my failure to get up to speed with neural nets at the time, it’s much more hopeful than that! Fast forward two years, and development within the field of deep learning has come on leaps and bounds. With serious development time going into TensorFlow, and a beautiful and accessible front end in the form of keras, the python user really does have the tools to apply neural nets to all sorts of applications within image-based studies.

Having learned the basic ideas around neural nets from my initial excitement a long time ago I decided to try and get involved with the community once more. A few months back, a well timed kaggle competition came up which involved image classification, which raised an eyebrow. I contacted an old friend of mine who had just finished his PhD in medical imaging and we set to take up the challenge.

river

The task for the competition involved labeling satellite imagery

Since starting the task, I feel like I’ve come on leaps and bounds with not only the concepts behind ConvNets, but their architecture and application in the python framework. Whilst we generated lots of code (will be on github in due course), and had lots of ideas floating about, we finished a decidedly average mid-table – this first pass was as much an experience in learning about organisation as well as about imaging science, but it’s made me rethink about using ConvNets in a Remote Sensing/Photogrammetry environment.

Whilst we are seeing more contributions coming out of the community, and the popularity of other less technical concepts like support vector machines have shown I’m hoping to extend my skill set to include all of these in the future. If anyone who happens to be reading this feel the same, don’t hesitate to get in touch!


Chroma

I’ve been neglecting this blog of late, partly because I’ve been ill and partly because I’ve been focusing my writing efforts elsewhere, but thought it was due time I put something up. Followers might remember that last year at EGU I presented a poster detailing results of investigating the variation of the greyscale input channel into Structure-from-Motion (SfM) photogrammetric blocks. Whilst the results showed very slight differences, I didn’t present one interesting, subtle effect, which shows how robust the process is to differences within images.

Within the SfM process, camera parameters which correct for distortions in the lens are fitted, which can subsequently be extracted for separate analysis. Returning to the greyscaling theme for inclusion in my final thesis, I’m pulling out the lens models for each block, and noticed the focal length being fitted to each block subtly changing, but in a manner we might expect.

Chromatic aberration

Chromatic aberration is caused by differences in the refractive indices of the glass in the lens between light of different wavelengths, which causes the focal point of the image formed for each wavelength to be slightly different. Thus, in colour images and for other optical equipment (I remember seeing it in many different sets of binoculars), we can see colour banding around the edges of high contrast features.

DSC00128_crop

Chromatic aberration seen at the front (red fringe) and back (green fringe) of the candle

Within photogrammetric blocks using single channel, we might expect the focal length to be optimised for specifically that colour’s focal length as it interacts with the specific lens being used. Indeed, this is demonstrable in the tests I have run – we see a slight lengthening of the focal length as more of the red channel is introduced to the image block accounting for the interaction with the lens, testing on an RGB image set collected of a cliff near Hunstanton, UK.

focal_lengths.png

Self-calibrating bundle adjustment fits longer focal lengths to greyscale bands containing a greater proportion of the red channel from an RGB image. Colours of the plotted points represent the RGB colour combination the greyscale photogrammetric block was derived from. The larger circles represent pure red, green and blue channels.

Whilst this might be expected, I was surprised by how obvious a trend was being shown, and it’s testament to how sensitive SfM is at picking up even small changes in image blocks. Watch this space for more insight into what this means for assessing quality of images going into SfM procedures, and how we might gain intuition into image quality as a result of this trend!

Django greyscales

Access the application here.

I’ve been learning lots about the django web framework recently as I was hoping to take some of the ideas developed in my PhD and make them into public applications that people can apply to their research. One example of something which could be easily distributed as a web application is the code which serves to generate greyscale image blocks from RGB colour images, a theme touched on in my poster at EGU 2016.

Moving from a suggested improvement (as per the poster) using a complicated non-linear transformation to actually applying it to the general SfM workflow is no mean feat. For this contribution I’ve decided to utilise django along with the methods I use (all written in python, the base language of the framework) to make a minimum working example on a public web server (heroku) which takes an RGB image as a user input and returns the same image with a number of greyscaling algorithms (many discussed in Verhoeven, 2015) as an output. These processed files could then be redownloaded and used in a bundle adjustment to test differences of each greyscale image set. While not set up to do bulk processing, the functionality can easily be extended.

web_out

Landing page of the application, not a lot to look at I’ll admit 😉

To make things more intelligible, I’ve uploaded the application to github so people can see it’s inner workings, and potentially clean up any mistakes which might be present within the code. Many of the base methods were collated by Verhoeven in a Matlab script, which I spent some time translating to the equivalent python code. These methods are seen in the support script im_proc.py.

Many of these aim to maximize the objective information within one channel, and are quite similar in design so it can be quite a difficult game of spot the difference. Also, the scale can often get inverted, which shouldn’t really matter to photogrammetric algorithms processes, but does give an interesting effect. Lastly, the second PC gives some really interesting results, and I’ve spent lots of time poring over them. I’ve certainly learned a lot about PCA over the course of the last few years.

web_out.png

Sample result set from the application

You can access the web version here. All photos are resized so they’re <1,000 pixels in the longest dimension, though this can easily be modified, and the results are served up in a grid as per the screengrab. Photos are deleted after upload. There’s pretty much no styling applied, but it’s functional at least! If it crashes I blame the server.

The result is a cheap and cheerful web application which will hopefully introduce people to the visual differences present within greyscaling algorithms if they are investigating image pre-processing. I’ll be looking to make more simple web applications to support current research I’m working on in the near future, as I think public engagement is a key feature which has been lacking from my PhD thus far.

I’ll include a few more examples below for the curious.


This slideshow requires JavaScript.

Sentinel bot source

I’ve been sick the last few days, which hasn’t helped in staying focused so I decided to do a few menial tasks, such as cleaning up my references, and some a little bit more involved but not really that demanding, such as adding documentation to the twitter bot I wrote.

While it’s still a bit messy, I think it’s due time I started putting up some code online, particularly because I love doing it so much. When you code for yourself, however, you don’t have to face the wrath of the computer scientists telling you what you’re doing wrong! It’s actually similar in feeling to editing writing, the more you do it the better you get.

As such, I’ve been using Pycharm lately which has forced me to start using PEP8 styling and I have to say it’s been a blessing. There are so many more reasons than I ever thought for using a very high level IDE and I’ll never go back to hacky notepad++ scripts, love it as I may.

In any case, I hope to have some time someday to add functionality – for example have people tweet coordinates + a date @sentinel_bot and have it respond with a decent image close to the request. This kind of very basic engagement for people who mightn’t be bothered going to Earth Explorer or are dissatisfied with Google Earth’s mosaicing or lack of coverage over a certain time period.

The Sentinel missions offer a great deal of opportunity for scientists in the future, and I’ll be trying my best to think of more ways to engage the community as a result.

Find the source code here, please be gentle, it was for fun 🙂

dainlptxkaajaaw

EGU 2017

As a result of a travel grant awarded to me by the Remote Sensing and Photogrammetry Society, I was lucky enough to be able to return to EGU this year, albeit only for the Wednesday. I was there to present my research, in a poster format, based on raw image processing in structure-from-motion workflows. After arriving in Vienna on Tuesday afternoon I went straight the hostel I was staying at to review my poster and to finalize the sessions I would go to.

I got to the conference early in the morning, and set up my poster which was to be presented during the high resolution topography in the geosciences session. After taking a short break to grab a coffee, I headed over to the first session of the day – Imaging, measurements and modelling of physical and biological processes in soils. After last year’s fascinating run of discussions about soil and soil erosion, I decided my one day at EGU would be largely dedicated to that theme!

One particular talk which caught my eye used data fusion of laser scanning and NIR spectrometry with the goal to couple the two datasets for use in examining feedbacks in soil processes. Some very cool kit, and very blue-sky research, a good way to start the day!

After lunch, I almost exclusively attended a land degradation session, which featured some very interesting speakers. Many focused on integrating modern techniques for prevention of soil erosion and gully formation into farming practices in Africa. Interestingly, while the talks almost all focused on case studies and success in showing the physical effects of taking these actions, the Q & As were very much about social aspects, and how to bring about the cultural change within farming communities.

Another notable talk was given by a group who were aiming to promote the use of a targeted carbon economy which sees citizens from carbon consuming countries pay for the upkeep and management of forestry in developing communities. The presentation was very clear and set solid numbers onto each factor introduced, which meant it was much easier to share the vision portrayed, definitely something I’ll be following in the future!

This lead to the poster session in which I was participating, which was well attended and seemed to generate lots of interest. By the time I arrived to present at the evening session, the 15 A4 posters I had printed had been hoovered up, which is always a good sign! Over the course of the hour and a half I was visited by many people who I had met before at various conferences – it’s always nice to have people you know come to say hello, especially as affable a bunch as geomorphologists!

out_poster.jpg

The poster I presented

One group of particular interest were from Trinity College Dublin, where I had done my undergraduate degree many moons ago. Niamh Cullen is doing research into coastal processes in the West of Ireland and is using photogrammetry to make some measurements, and so we had a very good discussion on project requirements/best strategy. She’s also involved in the Irish Geomorphology group, who’s remit seeks to establish a community of geomorphologists in Ireland.

In the evening I attended the ECR geomorphologist dinner, which was great fun, a good way to wrap up proceedings! I look forward to participating in EGU in the future in whatever capacity I can.

Notre Dame

SfM revisited

Snavely’s 2007 paper was one of the first breakout pieces of research bringing the power of bundle adjustment and self-calibration of unordered image collections to the community. It paved the way for the use of SfM in many other contexts, but I always appreciated how simple and focused the piece of work was, and how well explained each step in the process is.

snave

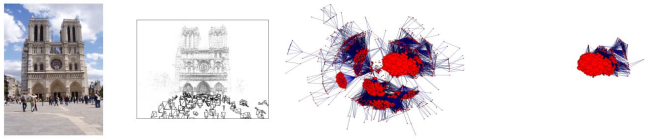
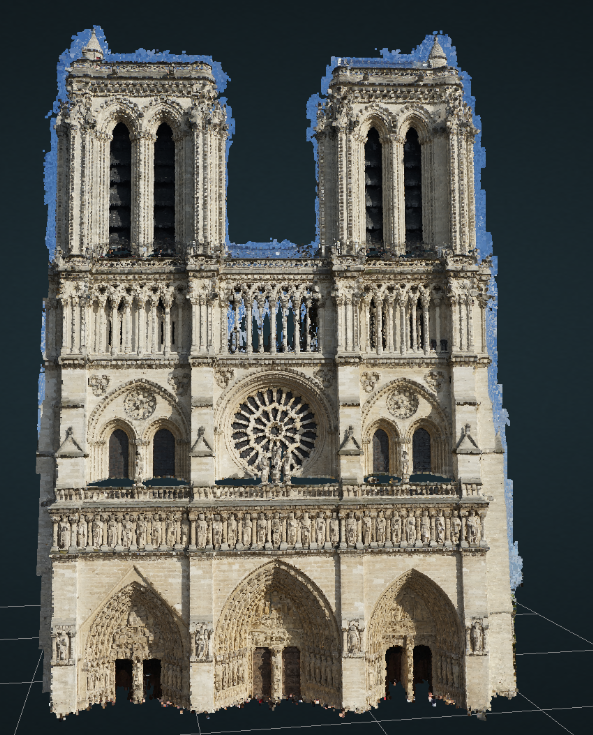
Reconstruction of Notre Dame from Snavely’s paper

For this contribution, I had hoped to try and recreate a figure from this paper, in which the front facade of the Notre Dame cathedral was reconstructed from internet images. I spent last weekend in Paris, so I decided I’d give a go at collecting my own images and pulling them together into a comparable model.

Whilst the doors of the cathedral were not successfully included due to the hordes of tourists in each image, the final model came out OK, and is view-able on my website here.
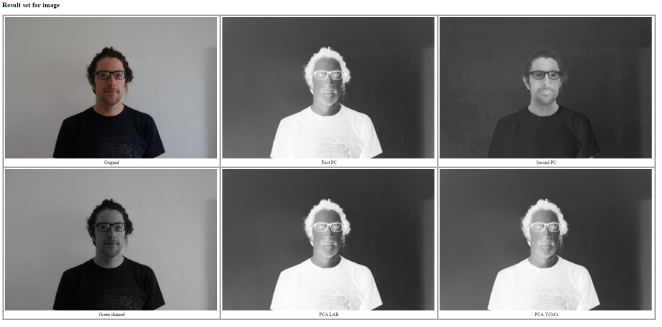
ND_cat.png

View of the Cathedral on Potree

HDR stacking

As a second mini-experiment, I thought I’d see how a HDR stack compared with a single exposure from my A7. The dynamic range of the A7, shooting from a tripod at ISO 50 is around 14EV stops, so  I wasn’t expecting a huge amount of dynamic range to be outside this, though potentially parts of the windows could be retrieved. For the experiment, I used both Hugin‘s HDR functionality and a custom python script using openCV bindings for generating HDR images which can be downloaded here.

Results were varied, with really only Merten’s method of HDR generation showing any notable improvement on the original input.

This slideshow requires JavaScript.

Some interesting things happened, including Hugin’s alignment algorithm misaligning the image (or miscalculating the lens distortion) to create a bowed out facade by default, pretty interesting to see! I believe, reading Robertson’s paper, his method was generated more to be used on grayscale images rather than full colour, but thought I’d leave the funky result in for completeness.

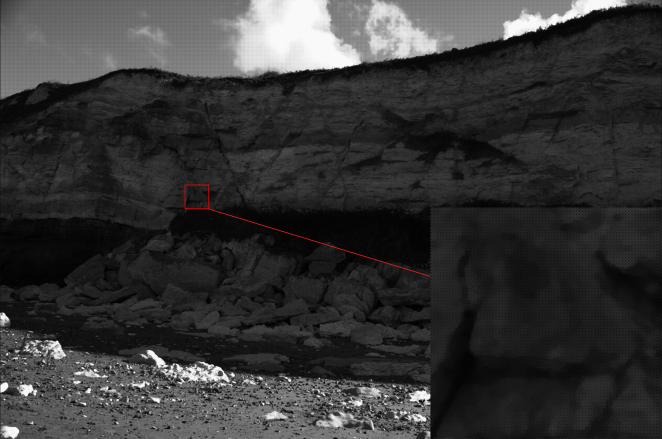
If we crop into the middle stain glass we can see some of the fine detail the HDR stacks might be picking up in comparison to the original JPG.

This slideshow requires JavaScript.

We can see a lot of the finer detail of the famous stained-glass windows revealed by Merten’s HDR method, which is very cool to see! I’m impressed with just how big the difference is between it and the default off-camera JPG.

Looking at the raw file from the middle exposure, much of the detail of the stain glass is still there, though has been clipped in the on-camera JPG processing.

fre

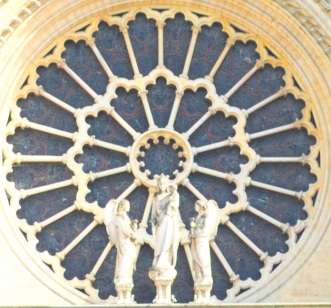
Original image processed from RAW and contrast boosted showing fine detail on stained glass

It justifies many of the lines of reasoning I’ve presented in the last few contributions on image compression, as these fine details can often reveal features of interest.

I had actually planned to present the results from a different experiment first, though will be returning to that in a later blog post as it requires much more explanation and data processing, watch this space for future contributions from Paris!