Weighing trees

I went to Mat Disney’s inaugural lecture at UCL last Tuesday. Mat was (is?) the course coordinator for the Masters in Remote Sensing at UCL, and was reflecting over his career, how he got to where he is and what the future might hold. I really enjoyed it, as there’s often a veil of mystery over senior academics. I’ll summarise the core points as they’re definitely of interest to wider audiences!
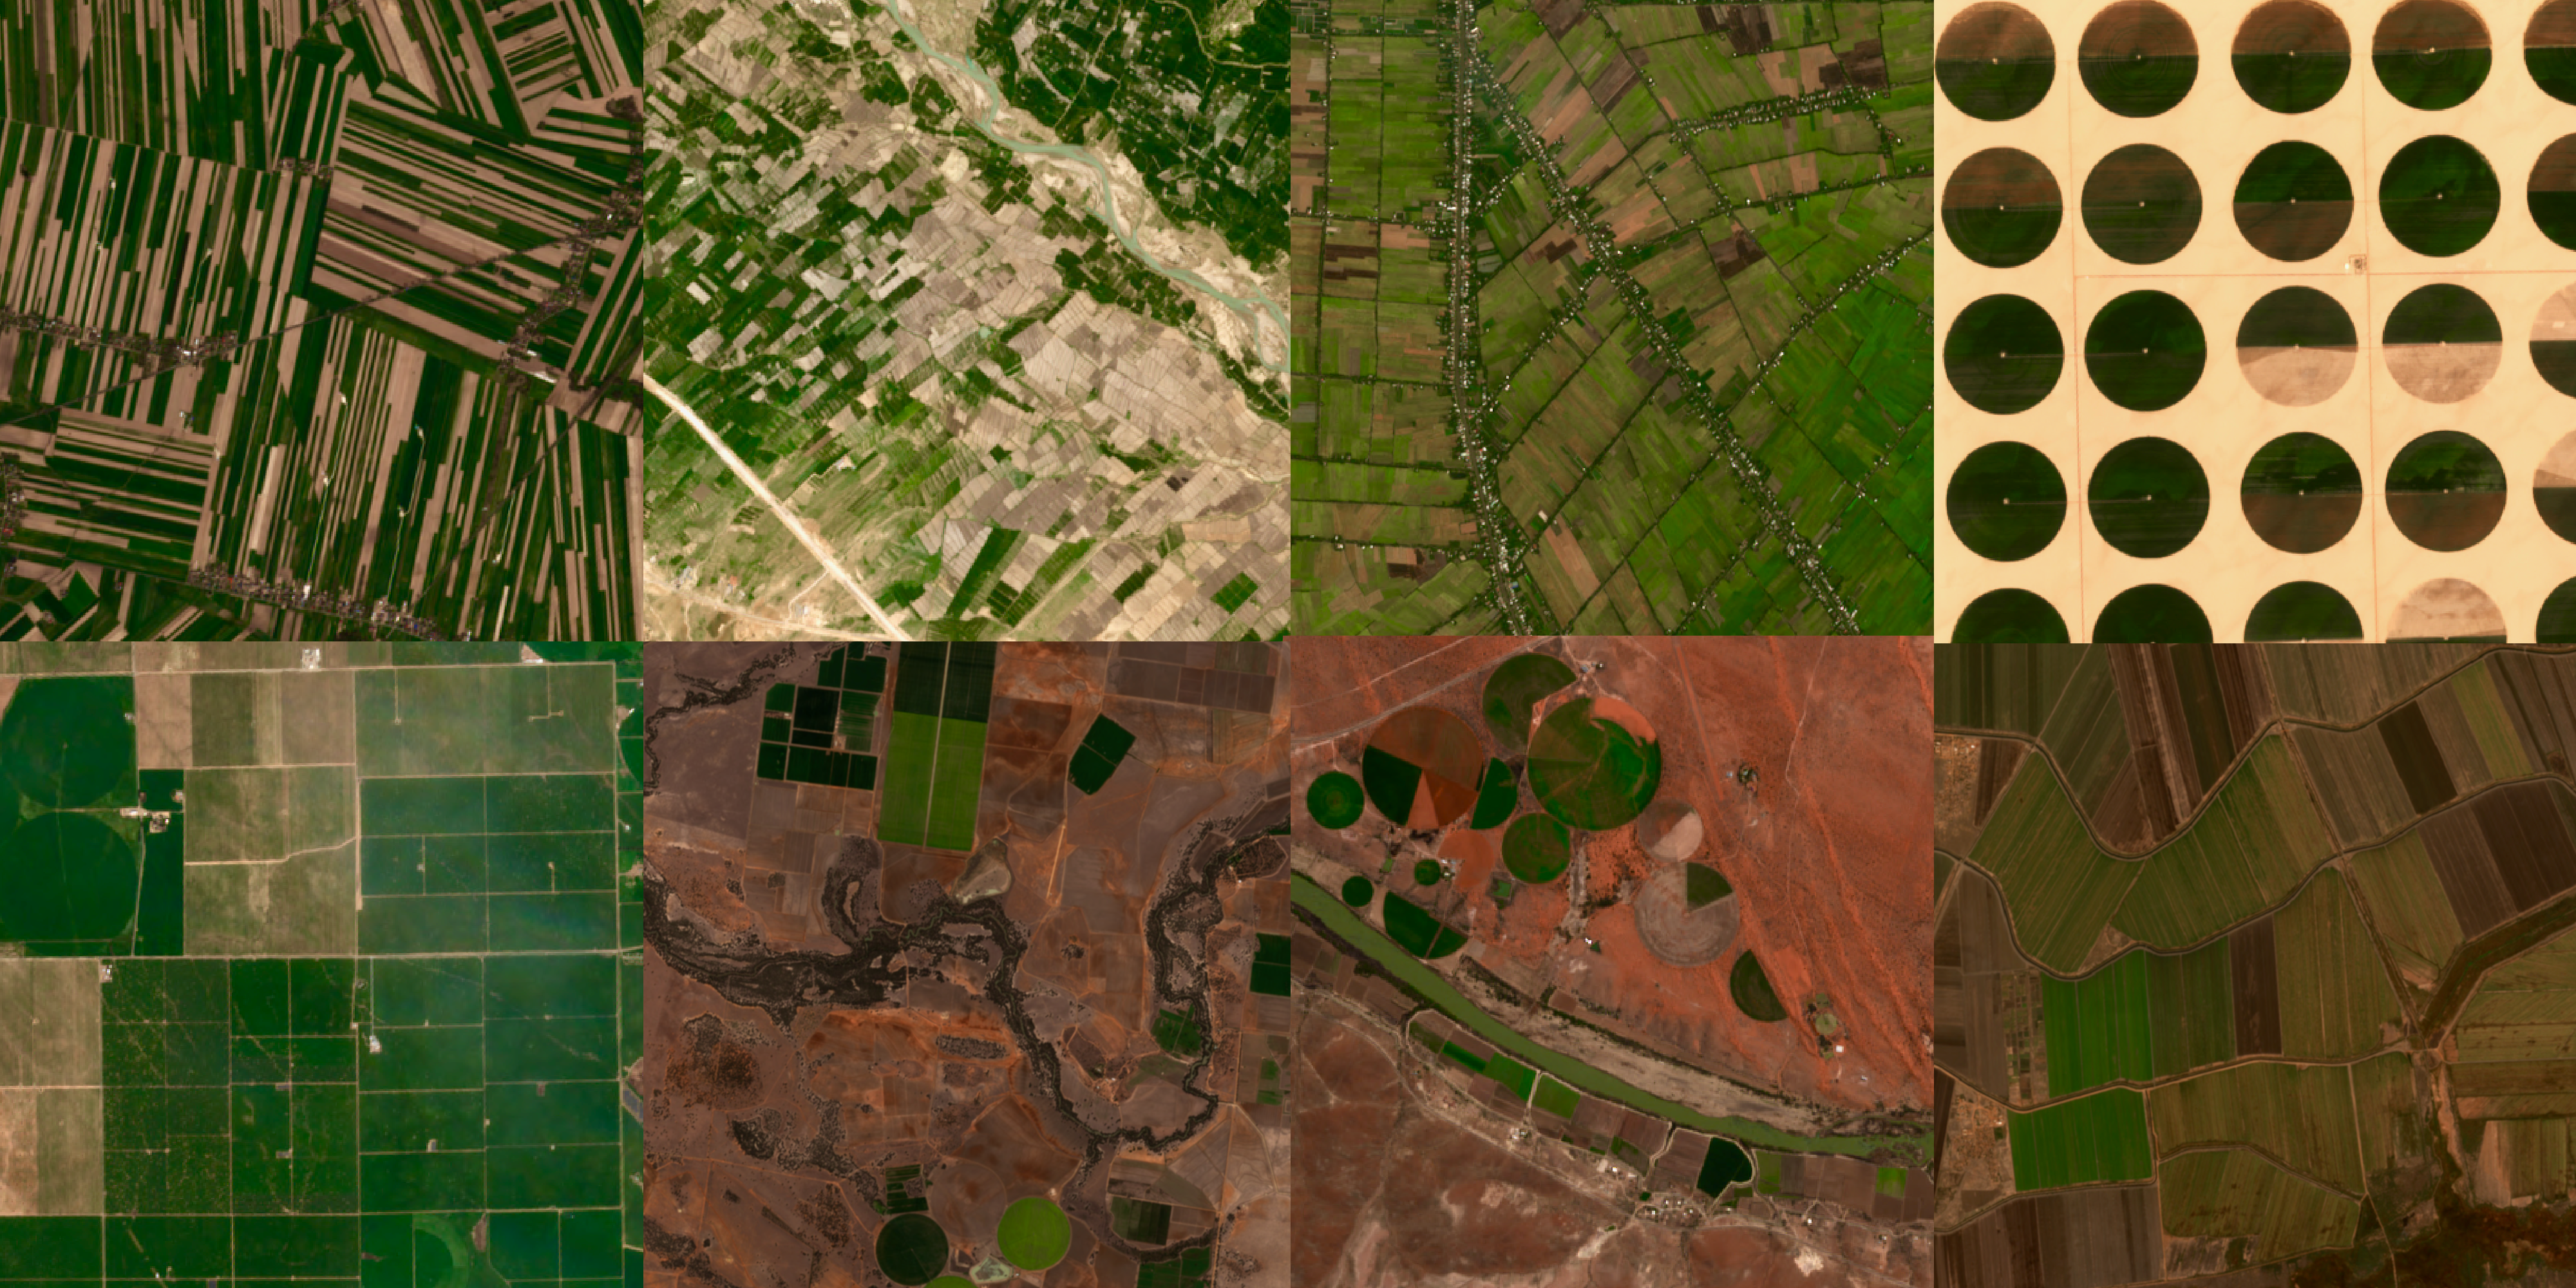
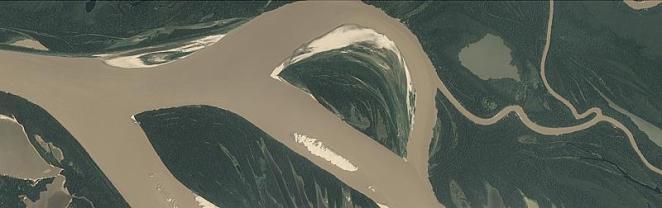
Trees are great

The view from the bottom of the tallest tropical tree in the world

Taken from Mat’s blog

One of the first ports of call was just a general discussion around trees. Their great diversity is worth celebrating, from the tall (up to 120m!) redwoods of west coast of the US to stumpy flat trees on the sides of windswept valleys, our scientific understanding of trees may be (and we will find out later, is) limited, but appreciating them as an amazing organism is worth doing in the first instance.

But trees are hard to weigh

Carbon estimates for trees are a crucial input to models driving climate change predictions, and Mat succinctly summarised the major gaps in knowledge associated with them. Firstly, to get a real measurement of the amount of carbon stored in a tree, you have no choice but to chop it down and weigh it. It’s a huge and grueling effort to do, so it’s no wonder that only 4,000 or so trees had been felled in tropical forests in 2015 – the extrapolation of which gives our estimates for the amount of carbon in tropical forests. Obviously, this has a huge implication for accuracy within these models, as the sample size and diversity of the sample is miniscule when scaled globally. Even in the UK, where you would expect the measurements to be more refined than the harsh environments of the tropics, we found out that carbon estimates in the UK are based upon a sample of 60 or so trees from a paper written in the late 60s, and a simple linear relationship used to extrapolate to he whole of the UK! in data science, we make lots of assumptions, but this is up there as a massive howler. So how can we hope to get more ground truth?

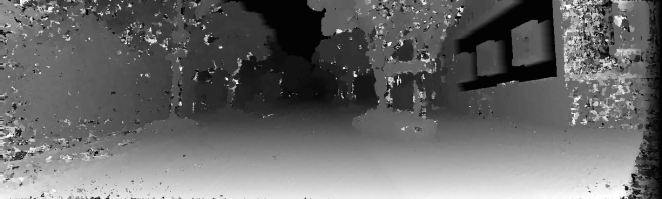
Lasers can weigh them

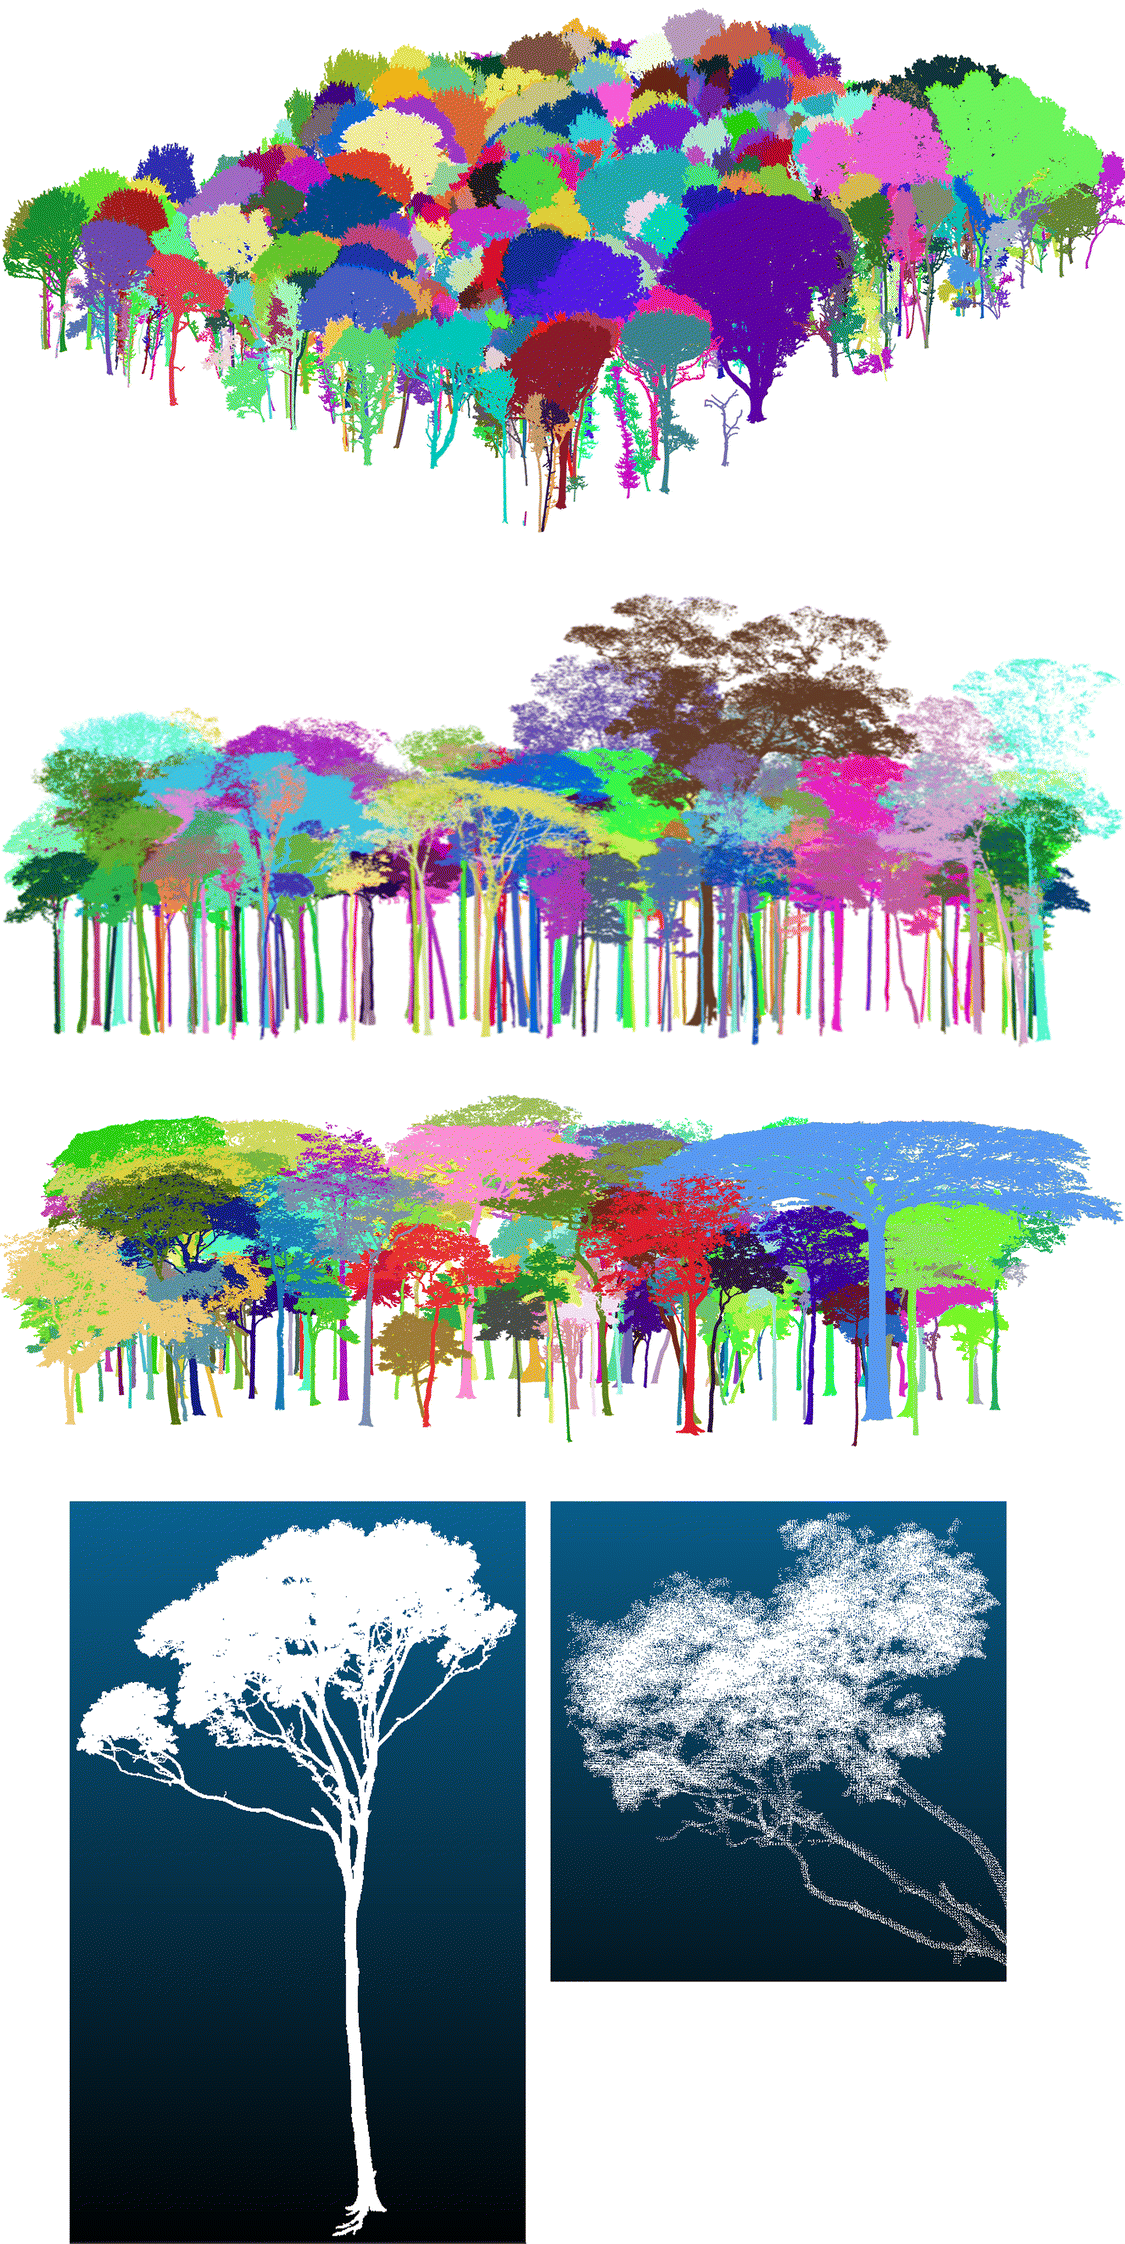
Image from Mat’s blog

Enter our hero, the reigl laser scanner, which has gone on tours of tropical forests across the globe, taking 3D images of trees to artificially weigh them where they stand. Mat has used these 3D images to redefine the principals of allometry – the science of relative size of measurements (such as brain size vs weight) – when it comes to trees. He reveals that allometric relationships underestimate carbon in tropical forests by as much as 20 %! In the UK, he revisited the 60 or odd samples off which all UK forestry estimates are based, and showed that these estimates are as far off as 120 %! These are really incredible figures that show how far wrong we’ve been going so far.
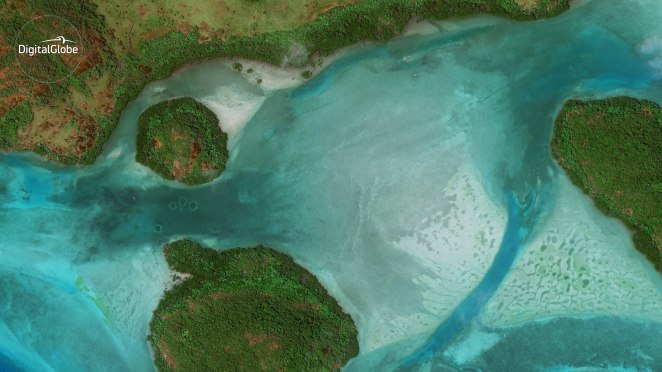
From space?

The GEDI (recently launched LiDAR) and BIOMASS (PolInSAR) missions are hoping to make the modelling of these ground truth data being recorded by the like’s of Mat to satellite data much tighter, which will hopefully vastly increase our ability to estimate carbon stores in tropical forestry. This, combined with the clear communication of Mat’s methods and the distinct gap in knowledge, make it very important and interesting research!

Lastly, I’d like to give a big congratulations to Mat on the chair, it was well earned!

Zappa

Zappa is a python library which hugely simplifies the deployment of web apps, by using AWS lambda functions (‘serverless’). In essence, the library packages up an existing app, for example a flask application, and generates the endpoints required as lambda functions.

Why is this useful?

Running servers, at least from a hobbyist level, can be pricy, especially if the app requires lots of resources. Lambda functions are perfect for applications which are used as a demo, or things which are only infrequently required, as the consumer pays only for the time the server is active, billed in ms on AWS.

The downsides?

Generally speaking, lambda functions have a start up time that’s slower than a 24/7 server. When a request comes in for a given function, if the function has not recently been called, it will need to be created before the request can be processed. This can be quite a high overhead for functions with many dependencies. Zappa helps out with this by keeping the function ‘warm’ – periodically sending a request to the function to keep it from being stripped down. If you have a lambda function which gets bursts of requests, it can take time to spin up clones of the functions, limiting its effectiveness in production environments.

Examples:

The terracotta library, which I have mentioned before on here, is a great example of how effective lambda functions can be. NDVI time series by Vincent Sarago is another great example.

Geodiversity

Radiant Earth, whose CEO Anne Hale Miglarese I was lucky enough to see speak at the RSPSoc conference last year, partnered with Amazon in order to provide more ‘geodiverse’ training data for machine learning models. I think this is timely, as the AI4EO paradigm sets in. The availability of Sentinel 2 Analysis Ready Data from s3, as well as the ability for partial reads of this data using gdal, is the preferred option vs. Google Earth Engine for me for geodevelopment, so I’m delighted on these continuing data releases. I’ve been reading about rastervision, and look forward to sinking my teeth into this data with that as a supporting tool to see what kind of learning can be done!

Geodiversity is required for reliable modelling (source)

Past Sentinel 2 data, there’s so much opportunity  to shift thinking on how to develop AI4EO models, extending to other metrics  such as air quality (for instance from Sentinel3 SLSTR).

Keep an eye on this space – I’ll do an jupyter notebook or similar exploring the data once I get the chance!

Earth from space

The BBC have released the first of a documentary series focusing on Remote Sensing, and how it has changed/can teach us about out changing planet. It’s definitely a tough subject to fill whole episodes with, so the style is somewhat blended between satellite imagery, and storytelling on the ground, which makes for a very different kind of wildlife documentary experience.

I’m particularly curious as to how they produced the ‘superzooms’, which involve both zooming into, and out from, individual elephants in Africa to a continent wide view, as  they’re extremely well done. I’m a bit skeptical as to how much space cameras are involved in videoing shaolin monks, and am curious which satellites would even have the capability for this – maybe Vivid-i could capture a short video sequence, but the resolution wouldn’t really be high enough to discern individuals, and the recently defunct Worldview-4 would only be able to capture stills. Regardless, it’s really a well paced, emotional episode which I enjoyed immensely.

worldview.jpg

Sample from Worldview-4, available here

The series continues next week with an episode on patterns – the dunes of Namibia are an area whose beauty I only really discovered through sentinel_bot and I’m looking forward to learning more!


Predictions, predictions, predictions

I’ve just listened to the latest episode of Alastair and Andrew‘s podcast, scene from above, and the discussion section based around near-future predictions for the Earth Observation (EO) industry, as well as some of the discussion in the news section, was extremely interesting. I’m fully onboard the hype train for machine learning booming in EO, with Andrew seemingly somewhat skeptical.

Before I go into why I think that’s the case, I’ll mention Alastair speaks about a Voyager documentary, the Farthest (I’ve actually just noticed a big Irish producer, crossing the line was involved in production, wahay!). It sounds absolutely incredible, and will go on my watch list, but Alastair’s comments reminded me of an xkcd comic alluding to the fact that the edge of the solar system is difficult to define! I actually really enjoyed listening to their thoughts on Voyager in general, and would love to hear more discussion around the history of EO as well as wider planetary missions – every time I read and think about Corona, for example, I can’t help but be amazed.

far

Voyager spacecraft (NASA)


One of the main predictions made within the main section of the podcast is that analysis ready data (ARD) will see wider use and release by data providers. We have seen a move towards sentinel 2 ARD and planet have recently released their atmospherically corrected surface reflectance product, I would hope this is an indication that this is quite well developed already!

planet.png

A figure from Planet’s surface reflectance white paper (source)

On the machine learning (ML) front, I attended a google earth engine workshop at the beginning of this year, and having had fruitful discussions with the host on the project’s directions, I think the iron is hot for ML and the hype justified. In particular, the host spoke about the team preparing tensor flow integration into the platform in time for AGU next year. Having been lucky enough to participate in (albeit not at a competitive level) the planet kaggle competition for classifying image excerpts into one or more classes last year, I have a decent idea of just why there has been a frenzy of research surrounding convolutional neural networks (CNNs) in the computer vision community, and I’m surprised that they haven’t appeared more in EO research.

While Andrew notes that supervised and unsupervised classification has been around and used for decades, the difference between those and deep-learned information is like night and day in my opinion. The competition, past the task presented, gave me a look into how neural networks are transforming image analysis, and how recurrent CNNs on massive scales could be leveraged in an environmental context for things like linking phenological mapping to data which might provide reasons as to why a change is happening with spatial context. Object-based analysis is unparalleled for applications like this, and CNNs are now so easy to use and much better at handling massive data sets than previous methods. Computer scientists are poised to integrate more and more with the EO community as higher resolution data becomes available, and so I feel like when high temporal and spatial resolution open data becomes available multi-disciplinary research will really kick off. Infact, I put together a starter ipython notebook for bird identification, showing just how easy it is using a pre-trained CNN for this application, albeit not with EO data.

birds.png

Example plot from ipython notebook

This leads to a prediction of my own – as more imaging scientists move into EO, Unmanned aerial vehicle (UAV) and satellite data will need to be better integrated. Currently, there are a raft of problems linking data collected from consumer level cameras onboard UAVs to satellite data, not least of which is radiometric normalization. The demand for higher resolution data from the deep learning end of the community will lead to new standards being introduced for how UAV data is collected and metadata stored (shameless plug). EO platforms will begin to integrate publicly collected UAV data and satellite researchers will begin to collaborate with computer scientists using nearer earth images. We will then see satellites being used as an early warning systems and UAV missions automatically launched off the back of satellite derived information in a range of new applications.

This isn’t a particularly insightful prediction, but one which continuously hasn’t really been addressed. I’m always surprised as to how infrequently satellite and UAV data are used in tandem, but I’m hoping this will change!

That’s all for now, look for my Google Earth Engine blog coming next week, I was blown away by the product and definitely need to do a separate post on it 🙂

Sentinel_bot – now with NIR vision

A quick blog post as I’m very much in the throes of writing! I took a few minutes today to introduce false colour (Near Infrared – Red – Green) images into @sentinel_bot’s programming, so now there’s a 20% chance that an image it produces will be false colour. In the near future I think I’ll introduce other band combinations (such as PCA band combos for mineral contrast enhancement), but for now I’m going to let it sit and appreciate some of what it comes up with, such as the image below.

Source : https://github.com/JamesOConnor/Sentinel_bot

Twitter : www.twitter.com/sentinel_bot

dgs6xtyxyaadcvj

NIR – R – G image over Argentina

Neural nets in Remote Sensing

Neural nets, a summary: (The chain rule * your GPU RAM)

Around 2 years ago I remember having a discussion with Jan Boehm about photogrammetry after my first meeting as the shadow wavelength rep on the Remote Sensing and Photogrammetry committee. He mentioned Agisoft, which I was already using and familiar with at the time, but then mentioned the movement in dense matching algorithms towards use of neural nets, mentioning one which had been submitted to the KITTI stereo benchmark.

right_cnn

Disparity map using Žbontar’s methods

This piqued my curiosity, and I remember reading and being quite excited by Jure’s paper. While some concepts were new to me, the use of Convolutional neural networks (ConvNets) and the two types of architecture used to initialize the initial results, before moving towards post-processing using semi-global matching. I remember sinking a great deal of time into reading about the methods, exploring the github and methods used within the core of the paper, and subsequently hounding a colleague who was using a Titan-X for some deep learning work for some time with it.

I remember I took the ideas with me to EGU 2016, and even went to the point of acquiring a data set I thought would be worthy of testing it with from a German photogrammetrist, Andreas Kaiser. Alas, it wasn’t to be due to the hardware limitations and the fact that I wasn’t very familiar with the lua programming language. However I had learned a lot about the nature of deep learning, which I felt was a decent investment of my time.

The reason for this blog entry, however, isn’t to enlighten the reader of my failure to get up to speed with neural nets at the time, it’s much more hopeful than that! Fast forward two years, and development within the field of deep learning has come on leaps and bounds. With serious development time going into TensorFlow, and a beautiful and accessible front end in the form of keras, the python user really does have the tools to apply neural nets to all sorts of applications within image-based studies.

Having learned the basic ideas around neural nets from my initial excitement a long time ago I decided to try and get involved with the community once more. A few months back, a well timed kaggle competition came up which involved image classification, which raised an eyebrow. I contacted an old friend of mine who had just finished his PhD in medical imaging and we set to take up the challenge.

river

The task for the competition involved labeling satellite imagery

Since starting the task, I feel like I’ve come on leaps and bounds with not only the concepts behind ConvNets, but their architecture and application in the python framework. Whilst we generated lots of code (will be on github in due course), and had lots of ideas floating about, we finished a decidedly average mid-table – this first pass was as much an experience in learning about organisation as well as about imaging science, but it’s made me rethink about using ConvNets in a Remote Sensing/Photogrammetry environment.

Whilst we are seeing more contributions coming out of the community, and the popularity of other less technical concepts like support vector machines have shown I’m hoping to extend my skill set to include all of these in the future. If anyone who happens to be reading this feel the same, don’t hesitate to get in touch!


Django greyscales

Access the application here.

I’ve been learning lots about the django web framework recently as I was hoping to take some of the ideas developed in my PhD and make them into public applications that people can apply to their research. One example of something which could be easily distributed as a web application is the code which serves to generate greyscale image blocks from RGB colour images, a theme touched on in my poster at EGU 2016.

Moving from a suggested improvement (as per the poster) using a complicated non-linear transformation to actually applying it to the general SfM workflow is no mean feat. For this contribution I’ve decided to utilise django along with the methods I use (all written in python, the base language of the framework) to make a minimum working example on a public web server (heroku) which takes an RGB image as a user input and returns the same image with a number of greyscaling algorithms (many discussed in Verhoeven, 2015) as an output. These processed files could then be redownloaded and used in a bundle adjustment to test differences of each greyscale image set. While not set up to do bulk processing, the functionality can easily be extended.

web_out

Landing page of the application, not a lot to look at I’ll admit 😉

To make things more intelligible, I’ve uploaded the application to github so people can see it’s inner workings, and potentially clean up any mistakes which might be present within the code. Many of the base methods were collated by Verhoeven in a Matlab script, which I spent some time translating to the equivalent python code. These methods are seen in the support script im_proc.py.

Many of these aim to maximize the objective information within one channel, and are quite similar in design so it can be quite a difficult game of spot the difference. Also, the scale can often get inverted, which shouldn’t really matter to photogrammetric algorithms processes, but does give an interesting effect. Lastly, the second PC gives some really interesting results, and I’ve spent lots of time poring over them. I’ve certainly learned a lot about PCA over the course of the last few years.

web_out.png

Sample result set from the application

You can access the web version here. All photos are resized so they’re <1,000 pixels in the longest dimension, though this can easily be modified, and the results are served up in a grid as per the screengrab. Photos are deleted after upload. There’s pretty much no styling applied, but it’s functional at least! If it crashes I blame the server.

The result is a cheap and cheerful web application which will hopefully introduce people to the visual differences present within greyscaling algorithms if they are investigating image pre-processing. I’ll be looking to make more simple web applications to support current research I’m working on in the near future, as I think public engagement is a key feature which has been lacking from my PhD thus far.

I’ll include a few more examples below for the curious.


This slideshow requires JavaScript.

Writing blues

After having been ill the last week and a half I’m currently trying to get back into the swing of writing, which I find is largely the hardest part of research where really it doesn’t/shouldn’t need to be. One thing in particular I find very difficult is starting – I often pore over the first words/sentence for a very long time when I do sit down to write.

One forward step I’ve come to in an attempt to mitigate this is to give myself as many opportunities as possible to start writing. While obviously this could involve carrying a pen and paper around everywhere and waiting for inspiration to hit, I think the practicalities of translating esoteric squiggles and keeping the notes in decent order a bit beyond me, so I rarely give it a proper go.

Enter the bluetooth keyboard, a product recommended to me by my supervisor to ensuring you can start taking notes/writing wherever you are. I was skeptical at first, due to the variable key size and slight faff of connecting via bluetooth to my phone, but after giving it a couple of hours on a recent visit to the RGS I was sold. Currently I’m typing up a version of this blog post on my phone sitting on a train from Holyhead to Chester on the way back to London. I’m getting great pleasure from watching the trees go by after every few sentences!

2d5dde0a-bac2-42c6-bf82-9bc28a34c520

Product photo from Microsoft’s site

While I know this entry will read like an advertorial, that isn’t the intention, I’m just very wary of the summer’s PhD writing ahead, and am glad to have an excuse to do the lion’s share sitting in a park rather than in my stuffy office! For now, back to writing, though I’m preparing a more technical blog post which should be finished later tomorrow.

for_up.jpg

Spotted from the train in Wales